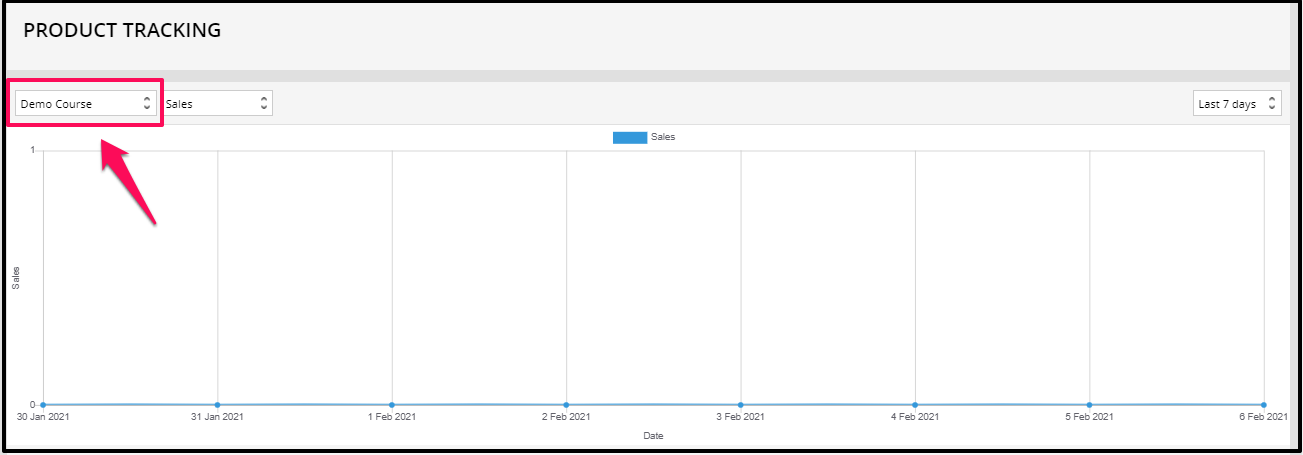
This feature will allow you to quickly see the performance of each product that you’re selling on your website.
You will be able to see the Sales, Total Revenue, Refunds, Refund Amount, Purchases, Purchases Revenue, Re bills, Re bills Revenue and Net Revenue for each product (Courses, Bundles or External product).
Important: This will only work using the built-in shopping cart (Stripe/PayPal).
Overview
On your admin dashboard, go to Analytics and then select Product Tracking. 
- At the top-left corner of the dashboard, in the first drop-down, select the product that you want to display on your graph.

- The second drop-down, select the stat you want to display on your graph for the selected product. You will have Sales, Total Revenue, Refunds, Refund Amount, Purchases, Purchases Revenue, Re bills, Re bills Revenue and Net Revenue option.

- At the top-right corner of the dashboard, from the drop-down, select a preset period you want to review or choose a Custom Period using the option at the bottom of the menu.
You will have a selection from Today, Yesterday, Last 7 days, Last 30 days, Last 90 days, All Time and lastly, Custom Period.
Below you will see the table with all the products listed and the numbers of each stat.
This is where you can quickly see which product is the most popular or selling the most. 
You can easily search a specific product you are looking for. Simply enter the name of the product to the Filter box. 
If you want to reorganize the results to see which product got the most sales, refund or purchases, simply click on the headers. 
